 | NICHD Archive Note: Information on this page was accurate at the time of publication. This page is no longer being updated. |
NICHD training and career development programs are critical to helping young researchers advance in fields relevant to the institute’s mission. Our commitment to these programs was echoed with the December 2016 passage of the 21st Century Cures Act, which called for NIH to provide opportunities for new researchers and promote earlier research independence. For decades, NICHD has sought to help young scientists acquire the knowledge and experience necessary to conduct independent research, and we are always looking for the best, most efficient way to accomplish this goal.
Historically, NICHD support for training has remained steady at 5 to 6 percent of the extramural budget, a level we plan to maintain. Within our portfolio is a mix of institutional grants (T32s and K12s), which universities use to develop training programs, and individual grants (Ks and Fs), which trainees use to propose specific research projects under the supervision of a mentor. When we analyzed our training programs and compared them to other NIH institutes, our results were striking: In fiscal year 2014, our institutional K12 programs occupied nearly 40% of our training portfolio; this far outweighed the investments of other NIH institutes (Figure 1).
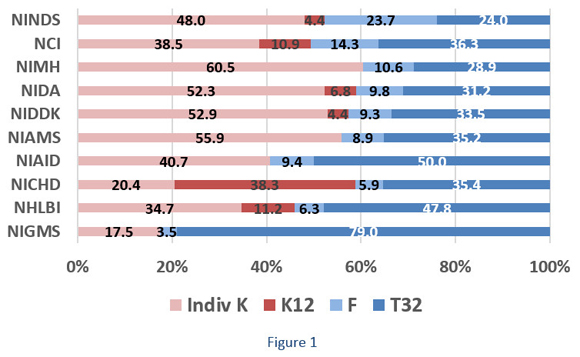
NICHD’s K12 programs have helped grow the fields of rehabilitation medicine and subspecialty areas of pediatrics, obstetrics and gynecology, and during a time when very few mentors existed in these areas. However, their larger-than-average share of the overall training budget led us to assess whether we currently have the right mix of individual and institutional training awards.
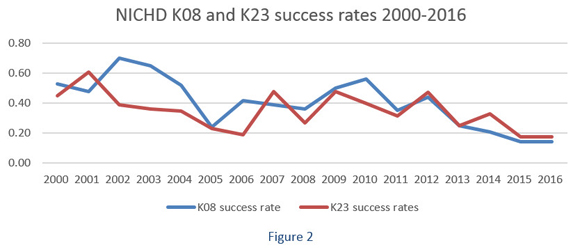
Over the years, expenditures on K12 programs have grown at a faster rate than expenditures in other training and career development mechanisms. At the same time, NICHD success rates for individual K awards (Figure 2) have declined and now are significantly lower than those of other NIH institutes. For example, 2016 success rates for individual K08 and K23 awards at the National Institute of Mental Health were 41.7 percent and 35.5 percent, respectively. In comparison, NICHD success rates for the same awards were 18 percent and 14 percent. Our concern is that such low success rates are limiting opportunities for scholars and early-stage investigators to receive essential research training.
To determine which training pathways have been the most successful in allowing junior investigators to receive independent (R series) research awards, we looked at a cohort of 355 physician-scientists who received NICHD support under K12 institutional career development awards or who received individual career development awards (K08, K23, or equivalent) between 1999 and 2001. These years were chosen so that former scholars would have had sufficient time to progress through the stages of career development. We wanted to see whether these individuals ultimately applied for an NIH grant.
The results, published recently in JAMA Pediatrics , suggest that trainees who received individual awards are more successful in their research careers than those supported solely by institutional awards. In our cohort, physician-scientists with an M.D. only, who received an individual K award or an individual K award with support from a K12 program, were significantly more likely to apply for and receive NIH funding, compared to those who only received K12 support (Figure 3). For physician-scientists with M.D. and Ph.D. degrees, application and funding rates, as analyzed by type of training pathway, were not significantly different.
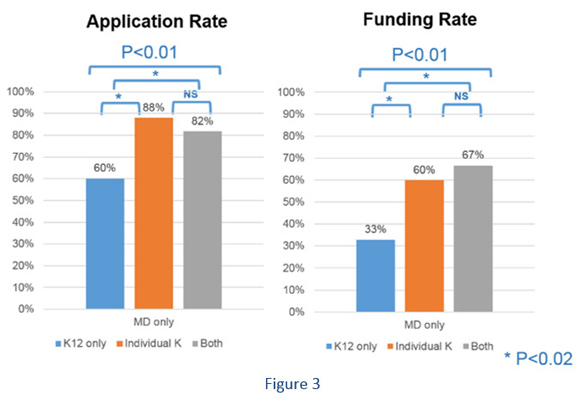
Our findings also suggest that trainees with solely an M.D. degree may need additional time to become competitive for subsequent NIH grant applications, so they should use a pathway that includes both institutional and independent K awards. M.D.-Ph.D. scholars presumably do not need additional time because of the additional training during their Ph.D. projects and theses.
I encourage you to read the paper for more details and discussion.
Moving forward, NICHD’s plan is to rebalance its training portfolio by shifting some of its funding from K12 awards to individual K awards. As noted earlier, we will maintain our investment in training awards at 5 to 6 percent of our extramural budget. We still recognize the importance of institutional career development programs and will continue to offer these awards. Overall, our analysis of NICHD’s training portfolio has revealed several opportunities to improve our support for new investigators so they can accumulate the necessary knowledge and skills to develop independent research careers and become productive researchers in areas related to NICHD’s mission.
 BACK TO TOP