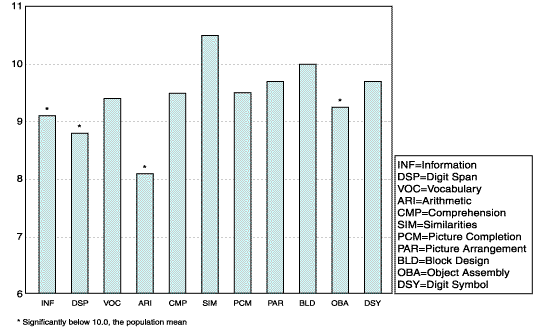
The content in this publication was current at the time it was published, but it is not being updated. The publication is provided for historical purposes only. Figure 3. WAIS-R Subtest Mean Scores for 64 PKUCS Adults Back to Appendix B Figures and Tables first | previous | next | last
 BACK TO TOP