NIH Consensus Development Conference on Rehabilitation of Persons with Traumatic Brain Injury
Appendix B
*Arizona, Colorado, Minnesota, Missouri, Oklahoma, New York (excluding New York City), South Carolina
The Epidemiology of Traumatic Brain Injury Among Children and Adolescents*
Kathleen A. Dunn, MD, MSPH
David J. Thurman, MD, MPH
Clinton J. Alverson, Jr., MS Division of Acute Care, Rehabilitation Research and Disability Prevention
National Center for Injury Prevention and Control
Centers for Disease Control and Prevention
Traumatic brain injury (TBI) is a leading cause of death and disability in the United States. Estimates suggest that each year among people of all ages, 260,000 are hospitalized, 51,000 die, and up to 90,000 have the onset of long-term disability related to TBI. 1-3 TBI thus represents a public health problem of great magnitude with profound consequences for those affected and for their families. However, the risk factors and consequences of these injuries have not been adequately characterized for the pediatric population. To demonstrate the burden and distribution of TBI incidence among children and adolescents and to highlight gaps in current knowledge, this paper describes the epidemiology of fatal and nonfatal traumatic brain injuries among persons aged 0-19 years, using population-based data.
METHODS
Definitions
The Centers for Disease Control and Prevention (CDC) defines traumatic brain injury as an occurrence of injury to the head (arising from blunt or penetrating trauma or from acceleration-deceleration forces) that is associated with any of the following symptoms or signs attributable to the injury: decreased level of consciousness, amnesia, other neurologic or neuropsychologic abnormalities, skull fracture, diagnosed intracranial lesions, or death. 4
For this analysis, causes of traumatic brain injury are broadly classified as transport-related, firearm-related, fall-related, and related to other causes. 5 Transport-related injuries are further classified as involving a motor vehicle occupant (i.e., occupants of automobiles, trucks, or buses), motorcyclist, pedal cyclist, or pedestrian. Firearm-related injuries are further classified by intent: unintentional, intentional self-inflicted (suicidal), intentional other-inflicted (assaultive or homicidal), and other (including legal interventions and injuries of undetermined intent).
TBI-associated Mortality for the United States, 1980-1994
We used the Multiple Cause-of-Death Public Use Data Tapes from the National Center for Health Statistics (NCHS) to identify TBI-associated deaths in the United States for the years 1980 through 1994. A death record that contained an ICD-9 code 6 in the ranges of 800.0 to 801.9, 803.0 to 804.9, 850.0 to 854.1, 873, 905.0 or 907.0 in any diagnostic field was included as a TBI-related death. We calculated annual age-, sex-, and race-specific death rates using U.S. resident population estimates from the Bureau of the Census for each year. Rates for all ages combined were not age-adjusted.
TBI-associated Hospitalizations and Mortality in Seven States, 1994
Since 1990, the National Center for Injury Prevention and Control (NCIPC) of the CDC, in collaboration with state health departments and other researchers, has been developing a multistate, population-based TBI surveillance system in order to better characterize the number of people sustaining traumatic brain injury, the underlying causes and risk factors, and the severity and outcome of these injuries. Seven state health departments provided data to CDC on cases of TBI occurring in 1994. State health departments in Arizona, Colorado, Minnesota, Missouri, Oklahoma, New York, and South Carolina reviewed statewide hospital discharge data collected from January 1, 1994 through December 31, 1994, using CDC guidelines to identify occurrences of TBI. 4 Cases included all patients discharged from acute care hospitals with primary or secondary diagnoses consistent with the CDC definition of an acute traumatic brain injury, i.e., ICD-9-CM diagnostic codes 7 800.0 to 801.9, 803.0 to 804.9, 850.0 to 854.1. ** Minnesota and New York provided hospital discharge data only. The other five states also provided supplementary information on severity and external cause of injury obtained from abstracts of medical records or health-care provider report forms for all cases (Missouri and Oklahoma) or from a representative sample of cases (31% of cases in Arizona, 47% of cases in Colorado, and 45% of cases in South Carolina). In addition, all states identified TBI-related deaths through a review of death certificates and medical examiner reports that listed TBI or head injury among the conditions associated with death. Records were linked to eliminate duplicate cases reported from more than one source.
Surveillance was statewide in all states except New York, which excluded residents of New York City. The combined TBI incidence rate for all seven states was calculated using the sum of the number of cases for each state and the sum of the population of each state estimated at the midpoint of 1994 (35.3 million total). Rates for all ages combined were not age-adjusted.
RESULTS
TBI-associated Mortality, United States, 1980-1994
In 1994, 8,694 people in the United States aged 0-19 years died from TBI, a crude rate of 11.6/100,000 population (Table 1). In comparison, the overall 1994 mortality rate from TBI for U.S. residents of all ages was 19.2/100,000 population, age-adjusted to the 1990 U.S. population. Between 1980 and 1994, the TBI-associated mortality rate for 0-19 year olds decreased 25%, compared to a decrease of 20% for persons of all ages.
Demographics
Age. TBI mortality rates were highest among 15-19 year olds (31.7/100,000 in 1994), almost six-fold higher than among 0-14 year olds (5.4/100,000 in 1994) (Figure 1). Between 1980 and 1994, TBI mortality rates decreased for all ages: 34% for 0-4 year olds, 38% for 5-9 year olds, 15% for 10-14 year olds, and 8% for 15-19 year olds.
Sex. Between 1980 and 1994, 71% of TBI-related fatalities among 0-19 year olds were male. In 1994, the rate of TBI-related death among males (16.6/100,000) was 2.8 times higher than the corresponding rate among females (6.4/100,000) (Figure 2). The male-to-female ratio increased with increasing age: in 1994, this ratio was lowest among 0-4 year olds (1.3) and highest among 15-19 year olds (3.8).
Race. Trends in rates of TBI-related death among children and adolescents differed among racial groups. While rates among whites decreased between 1980 and 1994, rates among African Americans increased sharply (Figure 3). Since 1988, the TBI-associated mortality rate among African Americans (16.7/100,000 in 1994) has been higher than the corresponding rate among whites and other races (10.8 and 8.3 per 100,000, respectively).
Cause of Injury
Transport-related Injury
From 1980 to 1994, the transport-related mortality rate associated with TBI decreased 44% among persons aged 0-19 years. Nevertheless, for this entire age group, transport-related injuries remained the leading cause of TBI-related mortality throughout this interval, representing 53% (4,577) of all TBI-related deaths in 1994 (Figure 4). Of these deaths, 58% were occupants of a motor vehicle, 17% were pedestrians, and 5% were bicyclists. Another 17%, classified as "unspecified person" involved in a motor vehicle collision, were most likely motor vehicle occupants 4 (Figure 5). Between 1980 and 1994, transport-related TBI mortality rates were consistently highest among 15-19 year olds (15.0/100,000 in 1994), about five-fold higher than among 0-14 year olds. Males had consistently higher transport-related TBI mortality rates than females (7.8/100,000 vs 4.3/100,000 in 1994).
An analysis of rates of TBI-related mortality within specific categories of transport-related TBI identified groups at highest risk. Youths aged 15-19 years, males, and whites were at highest risk of motor-vehicle occupant-related fatalities. Children aged 0-4 years, males, and African Americans were at highest risk of pedestrian-related fatalities. And 10-14 year olds and males were at highest risk of pedal cyclist-related fatalities. Risk for pedal cyclist-related injuries was similar among all races.
Firearm-related Injury
Between 1980 and 1994, the rate of TBI-related deaths attributed to firearms increased 59% among all persons aged 0-19 years. During this period, rates increased 103% for 15-19 year olds and 65% for 10-14 year olds. In 1994, 37% (3,203) of all TBI deaths among persons aged 0-19 years were firearm-related, a rate of 4.3/100,000 (Figure 4). Firearm-related TBI mortality rates were far higher among 15-19 year olds (15.2/100,000) than among 0-14 year olds in 1994 (0.9/100,000). Males had consistently higher firearm-related TBI mortality rates than females, although the rate for both sexes increased over this period. African Americans had higher firearm-related TBI mortality rates than whites and other races for all years.
Among persons aged 0-19 years, the TBI-related rate of suicide attributed to firearms rose 49% between 1980 and 1994 (Figure 6). In 1994, the rates of such injury were highest among 15-19 year olds (6.5/100,000) followed by 10-14 year olds (0.9/100,000). The rate among males was about seven times higher than the rate among females. Although the rate for whites remained higher than that for other races, the rate for African Americans increased 283% over this period, compared with an increase of about 40% for whites.
The TBI-related rate of homicide attributed to firearms also increased among 0-19 year olds between 1980 and 1994, from 1.0/100,000 to 1.9/100,000, surpassing the TBI-related rate of suicide attributed to firearms in 1991 (Figure 6). In 1994, the rate of TBI-related homicide attributed to firearms was highest among 15-19 year olds (6.8/100,000). The rate for males was four times higher than the rate for females in 1994. The rate for African Americans was consistently higher than the rates for whites and other races, ranging from 4-fold to 7-fold higher between 1980 and 1994.
Other Causes
Other important causes of TBI-related death among children and adolescents include child battering and homicides not involving firearms. In 1994, these accounted for 2% and 3%, respectively, of all deaths in this age group.
Combined Morbidity and Mortality: TBI-associated Hospitalizations and Deaths in Seven States, 1994
In 1994, the combined rate of TBI-related hospitalizations and deaths among persons aged 0-19 years in the seven states under surveillance was 90/100,000 population (Table 2), closely matching the crude rate of 91/100,000 for persons of all ages in these states. 1 Among all cases of TBI among persons aged 0-19 years, 13% resulted in death, compared with 23% that resulted in death from TBI among persons of all ages combined.
The rate of TBI was highest among adolescents aged 15-19 years (156/100,000), followed by 0-4 year olds (84/100,000) (Table 2). The rate for males was almost twice that for females, 117/100,000 vs 61/100,000. Because race was reported as unknown in 20% of reported cases, accurate race-specific rates could not be calculated.
Fifty-four percent of all TBIs among children and adolescents were transport-related, 24% were fall-related, and 5% were firearm-related, a distribution that contrasts sharply with the distribution of fatalities alone (Table 3). Falls were the leading cause of TBI among 0-4 year olds, while transport-related mishaps were the leading cause among all other age groups of children and adolescents (Figure 7).
Among persons aged 0-19 years, there was great variation by cause in the proportion of injuries with a fatal outcome. Firearm-related TBIs were far more likely to be fatal than TBIs associated with any other cause (Table 2). Eighty-three percent of firearm-related TBIs were fatal compared with 15% of transport-related TBIs, 1% of fall-related TBIs, and 6% of TBIs from other causes.
There were also differences among age categories in the proportion of TBIs with fatal outcome. Among 15-19 year olds, 21% of TBIs had a fatal outcome, compared with only 7% of TBIs among 5-9 year olds (Table 2). This difference may reflect the higher incidence of injuries related to firearm use and motor vehicle crashes among older adolescents (Figure 7).
Applying the 1994 TBI incidence rate from the seven state surveillance system (90/100,000) to the U.S. population aged 0-19 years (n=75,790,485), we estimate that approximately 68,000 persons aged 0-19 years sustained a TBI resulting in hospitalization or death in 1994. Applying a case fatality rate of 13.3% from the seven state surveillance system (Table 2), we estimate that about 9,000 of these children and adolescents died of their injuries, either before reaching a hospital or during their hospital stay, while over 59,000 youth survived.
DISCUSSION
Primary Prevention
The examination of national mortality data as well as combined morbidity and mortality data from seven states points to some success in the prevention of traumatic brain injury among children and adolescents. The overall TBI mortality rate decreased between 1980 and 1994, associated in large measure with decreased rates of transport-related TBI. This finding suggests a degree of success with TBI prevention efforts involving motor vehicle occupant protection and helmet use. 2,8-12 Although improved, rates of transport-related TBI remain high and call for further prevention efforts. Our findings, like the findings of other studies, 13,14 also identify other causes of TBI and groups at increased risk for which focused prevention efforts are needed.
The increasing TBI mortality rate among African-American youths---associated with an increasing incidence of firearm-related injury---deserves special attention. Given the very high proportion of fatalities among those with firearm-related TBI, effective and coordinated interpersonal violence prevention and suicide interventions are needed to address those at risk. 15 Prevention programs for intentional injuries among adolescents deserve special emphasis.
Secondary Prevention
As noted previously, we estimate that each year almost 60,000 American children and adolescents survive TBIs serious enough to require hospitalization. At the present time, the proportion of these young people who consequently experience cognitive or other disabilities is unknown. Nevertheless, the high incidence of TBI suggests that a large number of children and adolescents may have need of specialized care and services subsequent to these injuries, i.e., secondary and tertiary prevention interventions. Secondary prevention efforts addressing TBI (e.g., acute medical care) serve to mitigate and contain the acute effects of injury, while tertiary prevention efforts (e.g., rehabilitation) serve to minimize adverse outcomes and disability consequent to these injuries. We need better data in order to characterize the need for secondary and tertiary prevention programs for children and adolescents with TBI.
With the development of CDC?s multistate surveillance system, we can estimate population-based rates of TBI and can begin to characterize the severity and outcome of these injuries. However, there remain important issues related to TBI-related disability that should be addressed by the development of a population-based registry for TBI among children and adolescents.
- There are critical developmental concerns unique to young populations. Because cognitive and other neuropsychological abilities develop at specific ages, disruptions of this process by TBI may lead to a cascade of adverse effects with potential lifelong consequences. 16,17 A better understanding of these processes is necessary to determine the need for developmentally and age-appropriate rehabilitation resources.
- Long-term population-based follow-up studies of children and adolescents who have TBI are needed to better understand the consequences of these injuries, to measure their impact on later school performance and social integration, and to describe risk factors among young persons who are injured that may identify those most in need of rehabilitation services. Unfortunately, existing systems for measuring injury outcome and TBI-related disability among children and adolescents are limited. Better measures of functional outcome after acute medical care and rehabilitation are necessary to assess the population-based need for and the effect of rehabilitation services. This is critical information that deserves high priority for further study.
- Population-based data on access to rehabilitation services among those aged 0-19 years are not available. With changing incidence and survival patterns, as well as changes in health care delivery, there is a need to describe access to rehabilitation services for young people and to identify the factors that influence this access.
Much work remains to be done in the assessment, treatment, and prevention of traumatic brain injury, especially among the pediatric population. The findings of this paper highlight the need for standardized, state-based surveillance systems that can be used to describe the national incidence, causes, risk factors, severity, and---especially---outcomes of traumatic brain injury. Such systems are essential for identifying those at risk for TBI, and for designing primary, secondary, and tertiary prevention programs, helping to assess the effectiveness of rehabilitation programs, and assuring access to these programs for persons with TBI.
*Paper provided by the Center for Disease Control Prevention.
**In contrast with the case definition of TBI used with NCHS mortality data, the case definition of TBI used in the multistate surveillance system does not include the ICD-9 diagnostic codes for late effects of injury (905.0 and 907.0). The code for open wounds of the head (873) is included only for fatal cases.
Table 1. Fatal traumatic brain injuries, ages 0-19 years, United States, 1994 (Population =75,790,485)
| Characteristic | Number of Deaths | Deaths/100,000 population |
|---|---|---|
| Age 0-4 | 1,275 | 6.5 |
| Age 5-9 | 658 | 3.5 |
| Age 10-14 | 1,176 | 6.3 |
| Age 15-19 | 5,585 | 31.7 |
| Males | 6,362 | 16.6 |
| Females | 2,332 | 6.4 |
| Race of Caucasion | 6,439 | 10.8 |
| Race of African American | 1,943 | 16.7 |
| Other Race | 312 | 8.3 |
| Cause of Transport | 4,577 | 6.1 |
| Cause of Motor Vehicle, Occupant | 2,646 | 3.5 |
| Cause of Motor Vehicle, Unspecified Person | 789 | 1.1 |
| Cause of Pedestrian | 768 | 1.0 |
| Cause of Pedal Cyclist | 225 | 0.3 |
| Cause of Motorcyclist | 88 | 0.1 |
| Cause of Other Transport | 61 | 0.1 |
| Cause of Firearms | 3,203 | 4.3 |
| Cause of Homicide | 1,436 | 1.9 |
| Cause of Suicide | 1,307 | 1.7 |
| Cause of Unintentional | 342 | 0.5 |
| Cause of Legal Intervention, War, Undetermined Intent | 118 | 0.2 |
| Cause of Falls | 162 | 0.2 |
| Other Cause | 752 | 1.0 |
| TOTAL | 8,694 | 11.6 |
Table 2. Number and rate of traumatic brain injuries resulting in hospitalization or death, ages 0-19 years, seven states, a 1994 (Population = 10,223,745)
a Arizona, Colorado, Minnesota, Missouri, New York (excluding New York City), Oklahoma, South Carolina
b Includes deaths occurring outside the hospital setting (out-of-hospital deaths) and in-hospital deaths
c Includes out-of-hospital deaths and all hospitalized cases
d Defined as: ([out-of-hospital deaths + hospitalized cases] / population) H 100,000
e Defined as: ([out-of-hospital deaths + in-hospital deaths] / [out-of-hospital deaths + hospitalized cases]) H 100
f Numbers of cases are estimated from samples of cases in some states. Subcategories may not add up to total due to rounding errors in this process.
| Characteristic | TBI deaths (#) b | TBI cases (#) c | TBI rate d (per 100,000) | Percent fatal e |
|---|---|---|---|---|
| Age 0-4 | 167 | 2,202 | 83.6 | 7.6 |
| Age 5-9 | 105 | 1,458 | 56.2 | 7.2 |
| Age 10-14 | 169 | 1,777 | 68.7 | 9.5 |
| Age 15-19 | 782 | 3,754 | 155.7 | 20.8 |
| Males | 875 | 6,147 | 117.3 | 14.2 |
| Females | 349 | 3,043 | 61.1 | 11.5 |
| Cause of Transport | 737 | 5,008 | 49.0 | 14.7 |
| Cause of Motor Vehicle Occupant | 471 | 3,081 | 30.1 | 15.3 |
| Cause of Motorcyclist | 17 | 188 | 1.8 | 9.0 |
| Cause of Pedal Cyclist | 36 | 720 | 7.0 | 5.0 |
| Cause of Pedestrian | 104 | 684 | 6.7 | 15.2 |
| Cause of Motor Vehicle (Unspecified Person), and Other Transport | 109 | 335 | 3.3 | 32.5 |
| Cause of Firearms | 367 | 443 | 4.3 | 82.8 |
| Cause of Assaultive | 118 | 156 | 1.5 | 75.6 |
| Cause of Self-inflicted | 168 | 176 | 1.7 | 95.5 |
| Cause of Unintentional | 46 | 61 | 0.6 | 75.4 |
| Cause of Legal Intervention, War, Undetermined Intent | 35 | 51 | 0.5 | 68.6 |
| Cause of Falls | 28 | 2,200 | 21.5 | 1.3 |
| Other Cause | 92 | 1,538 | 15.5 | 6.0 |
| TOTAL | 1,223 | 9,191 | 89.9 | 13.3 |
Table 3. Distribution of cause of injury among fatal TBIs only (U.S. residents aged 0-19 years) vs. hospitalized TBIs plus out-of-hospital TBI fatalities (0-19 year olds in seven state surveillance system)
* Arizona, Colorado, Minnesota, Missouri, New York (excluding New York City), Oklahoma, South Carolina
| Cause of Injury | United States (deaths only) % | Seven states * (hospitalizations plus out-of-hospital deaths) % |
|---|---|---|
| Transport | 53 | 54 |
| Firearms | 37 | 5 |
| Falls | 2 | 24 |
| Other causes | 9 | 17 |
BIBLIOGRAPHY
- Centers for Disease Control and Prevention. Traumatic Brain Injury in the United States: An Interim Report to Congress. Atlanta: Centers for Disease Control and Prevention, 1998 (in press).
- CDC. Traumatic brain injury -- Colorado, Missouri, Oklahoma, and Utah, 1990-1993. MMWR. 1997;46(1):8-11.
- Kraus JF. Epidemiology of head injury. In: Cooper PR, ed. Head Injury. 3rd ed. Baltimore, MD: Williams & Wilkins, 1993. pp1-25.
- Thurman DJ, Sniezek JE, Johnson D, Greenspan A, Smith SM. Guidelines for Surveillance of Central Nervous System Injury. Atlanta: Centers for Disease Control and Prevention, 1994.
- Centers for Disease Control and Prevention. Recommended framework for presenting injury mortality data. MMWR 1997;46 (No. RR-14):1-30.
- World Health Organization. International classification of diseases, 9th revision (ICD-9). Geneva: World Health Organization, 1977.
- U.S. Department of Health and Human Services. International classification of diseases, 9th revision, clinical modification. Third ed. Washington DC: U.S. Department of Health and Human Services, 1989.
- Rivara FP, Grossman DC, Cummings P. Injury Prevention: First of Two Parts. The New England Journal of Medicine. 1997;337(8):543-548.
- Rivara FP, Grossman DC, Cummings P. Injury Prevention: Second of Two Parts. The New England Journal of Medicine. 1997;337(9):613-618.
- Bolen JR, Sleet DA, Johnson VR (eds). Prevention of motor vehicle-related injuries: A compendium of articles from the Morbidity and Mortality Weekly Report, 1985-1996. National Center for Injury Prevention and Control. Atlanta, GA. 1997.
- Sosin DM, Sacks JJ. Motorcycle helmet-use laws and head injury prevention. JAMA. 1992;267:1649-1651.
- Sosin DM, Sacks JJ, Webb KW. Pediatric head injuries and deaths from bicycling in the United States. Pediatrics. 1996;98(5):868-870.
- Ikeda RM, Gorwitz R, James SP, Powell KE, Mercy JA. Trends in fatal firearm-related injuries, United States, 1962-1993. American Journal of Preventive Medicine. 1997;13(5):396-400.
- Rivara FP. Epidemiology and prevention of pediatric traumatic brain injury. Pediatric Annals. 1994;23(1):12-17.
- Powell KE, Hawkins DF (ed). Youth violence prevention: Descriptions and baseline data from 13 evaluation projects. American Journal of Preventive Medicine. 1996; Supplement to Volume 12, Number 5.
- Shapiro K. Head injury in children. In: Becker DP, Povlishock JT (eds.) Central Nervous System Trauma Status Report, 1985. National Institute of Neurological and Communicative Disorders and Stroke, National Institutes of Health. 1985. pp243-253.
- Levin HS, Ewing-Cobbs L, Fletcher JM. Neurobehavioral outcome of mild head injury in children. In: Levin HS, Eisenberg HM, Benton AL. Mild Head Injury. New York: Oxford University Press, 1989. pp189-213.
Figures
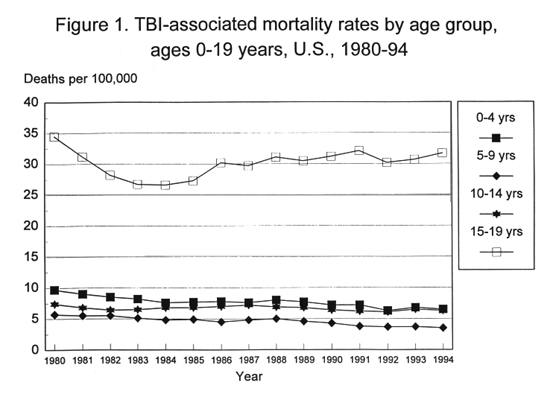
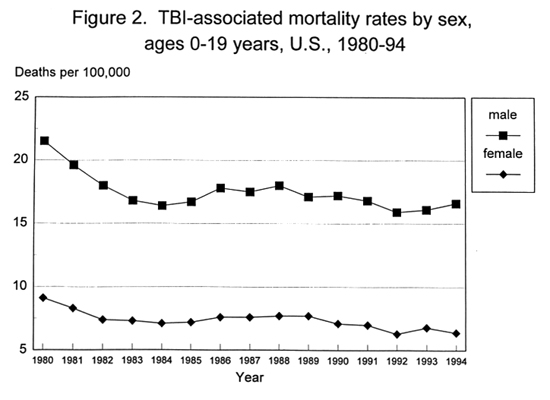
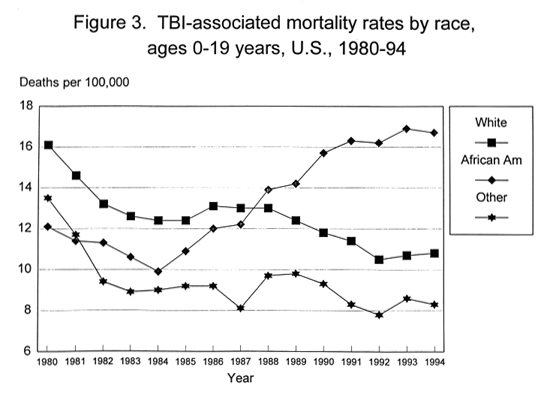
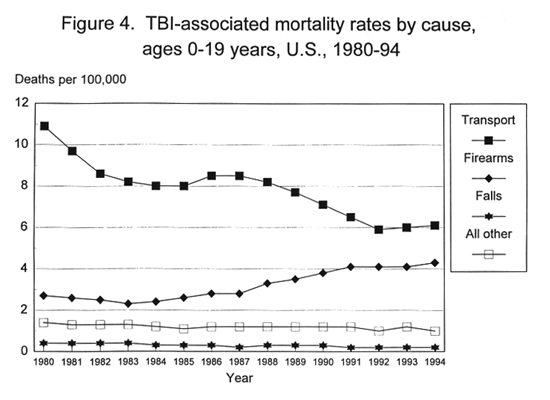
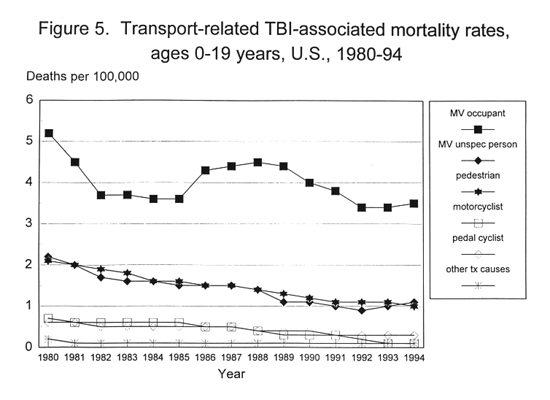
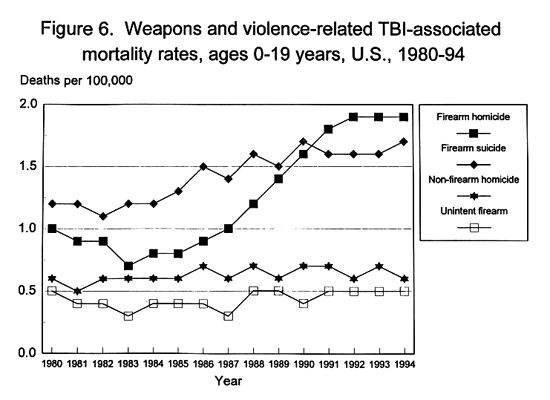
Figure 7. Percent of TBIs by cause of injury among fatal cases only compared to hospitalized cases plus out-of-hospital deaths, ages 0-19 years, 1994
| United States (deaths only) | Seven states* (hospitalizations and out-of-hospital deaths) | |
|---|---|---|
| Transport | 53 | 54 |
| Firearms | 37 | 5 |
| Falls | 2 | 24 |
| Other | 9 | 17 |
 BACK TO TOP