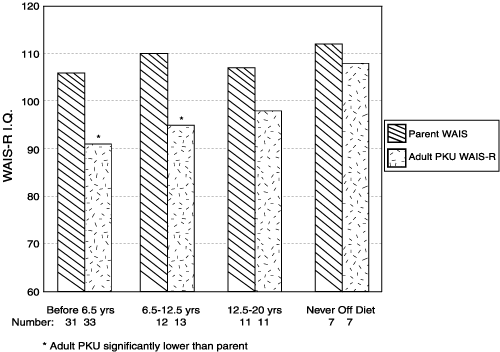
The content in this publication was current at the time it was published, but it is not being updated. The publication is provided for historical purposes only. Figure 4. PKUCS Adult WAIS-R Scores Grouped by Age at Diet Discontinuation Back to Appendix B Figures and Tables first | previous | next | last
 BACK TO TOP